
Ethereum (ETH) and Solana (SOL): Bull Flags Signal Big Moves Ahead
Bitcoin (BTC) is forming a bull flag. If it holds, and the price is able to exit from the top, the next leg of the bull run could ensue. Ethereum (ETH) and Solana (SOL), heavily backed altcoins, have formed/are forming their own bull flags. If $BTC breaks out, watch for $ETH and $SOL to follow suit and continue outperforming.
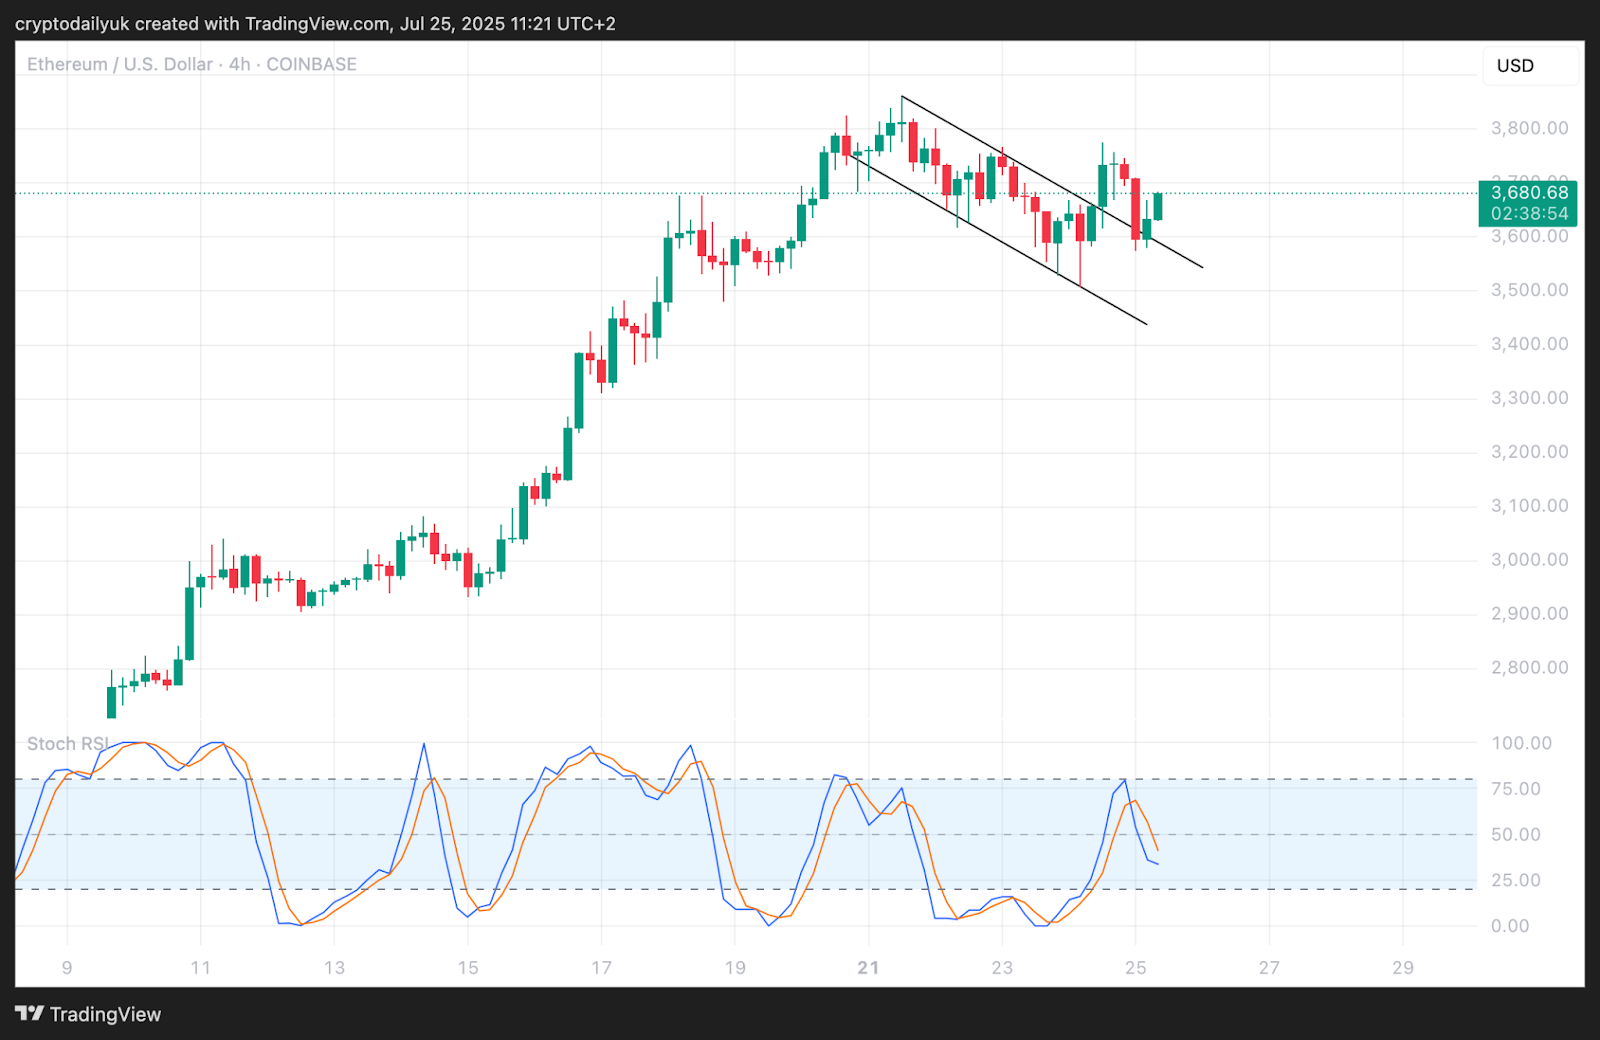
$ETH price confirms breakout from bull flag
Source: TradingView
The inexorable rise for the $ETH price looks as though it’s about to get underway again. A short hiatus for a bull flag has come to an end as the price has broken through the top, has returned to confirm the breakout, and is now heading higher.
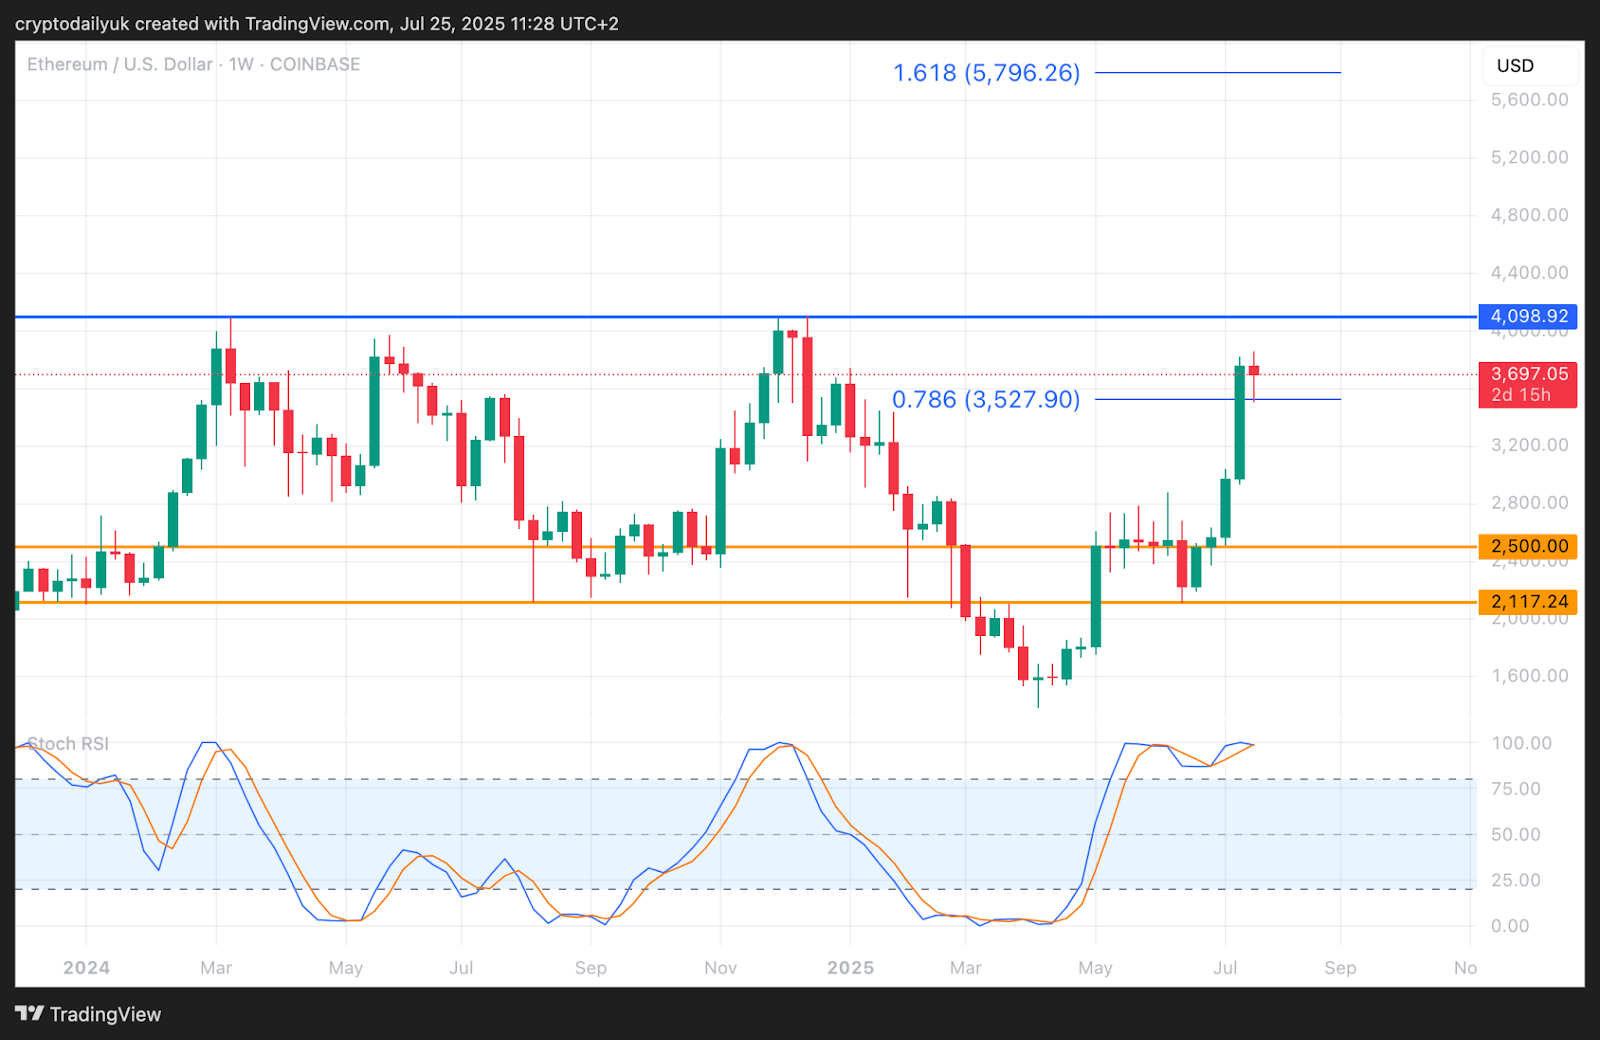
$ETH longer term targets
Source: TradingView
The weekly chart for the $ETH price reveals that the recent correction took the price back to confirm the 0.786 Fibonacci extension level at $3,530. The next target is the $4,100 horizontal resistance. After this, the all-time high is a target at $4,870, and then the 1.618 Fibonacci level for this move is at $5,800.
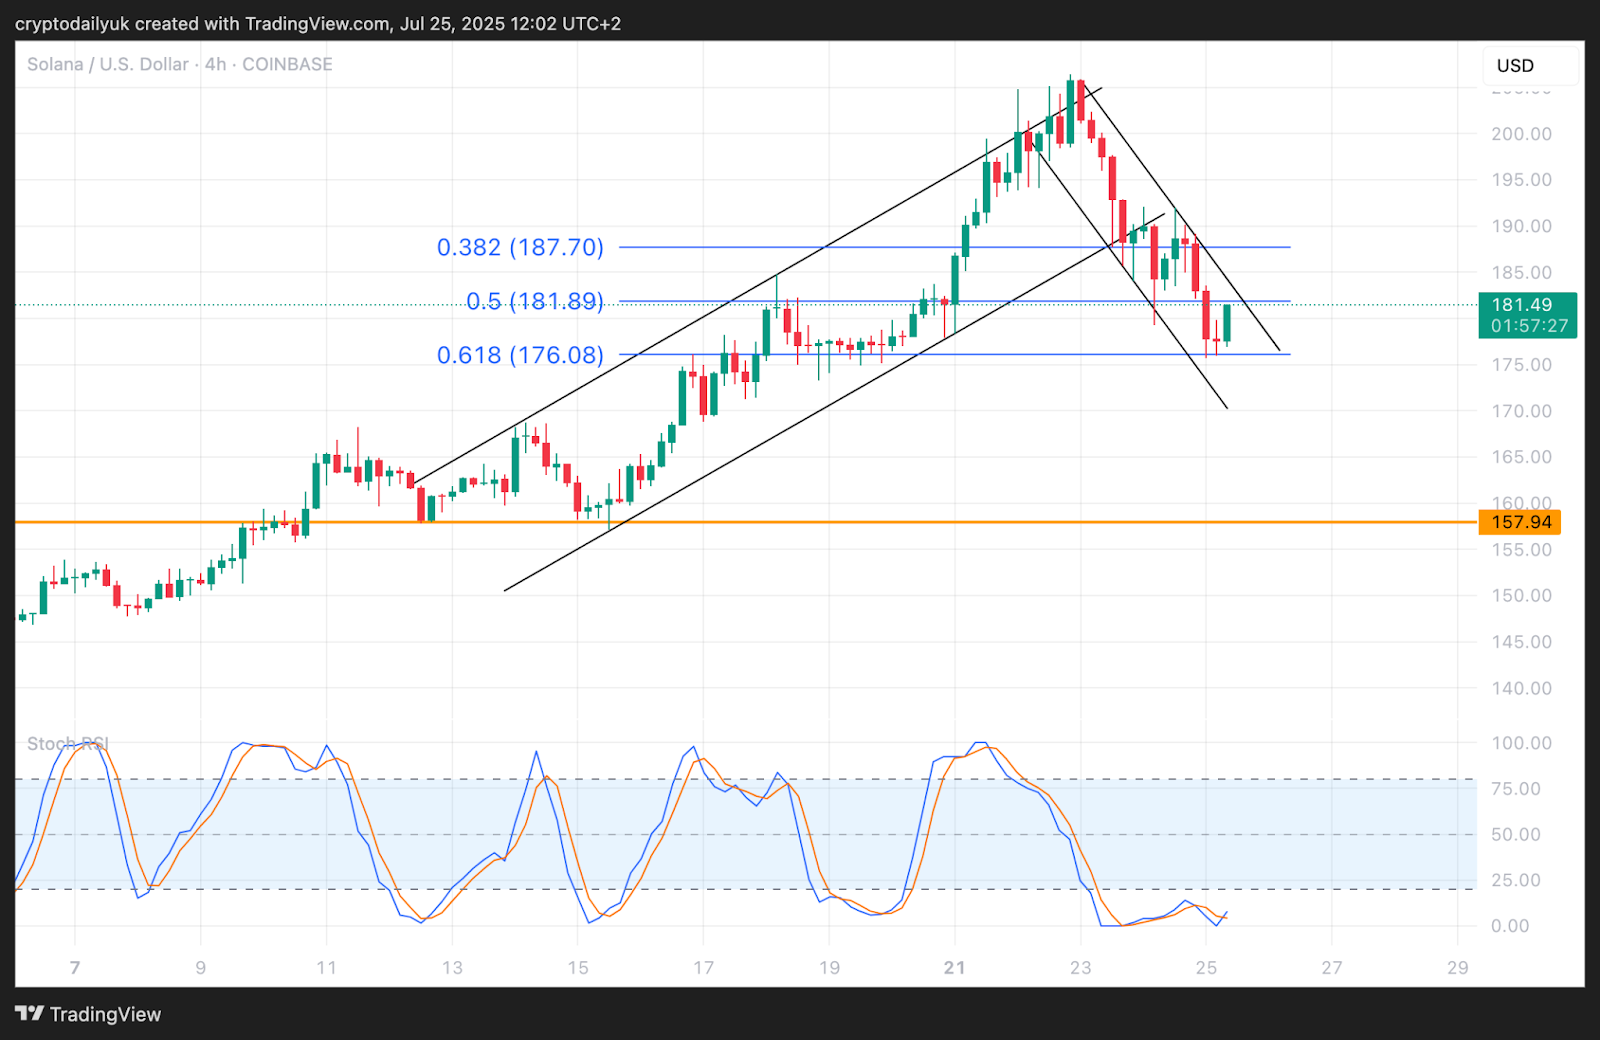
$SOL bull flag breakout is coming
Source: TradingView
The 4-hour chart for the $SOL price contains a lot of bullish information. After bouncing off of the strong horizontal support at $157, the price rose within a channel for a couple of weeks, before falling out of the bottom.
This drop has so far gone all the way down to the 0.618 Fibonacci level, from where it is looking as though it will bounce.
It can be seen that the downturn has been within a descending channel, which taken together with the rise from $157, has formed a bull flag. With all the shorter term Stochastic RSI indicators having hit bottoms, it might be imagined that a breakout from this bull flag could happen shortly.
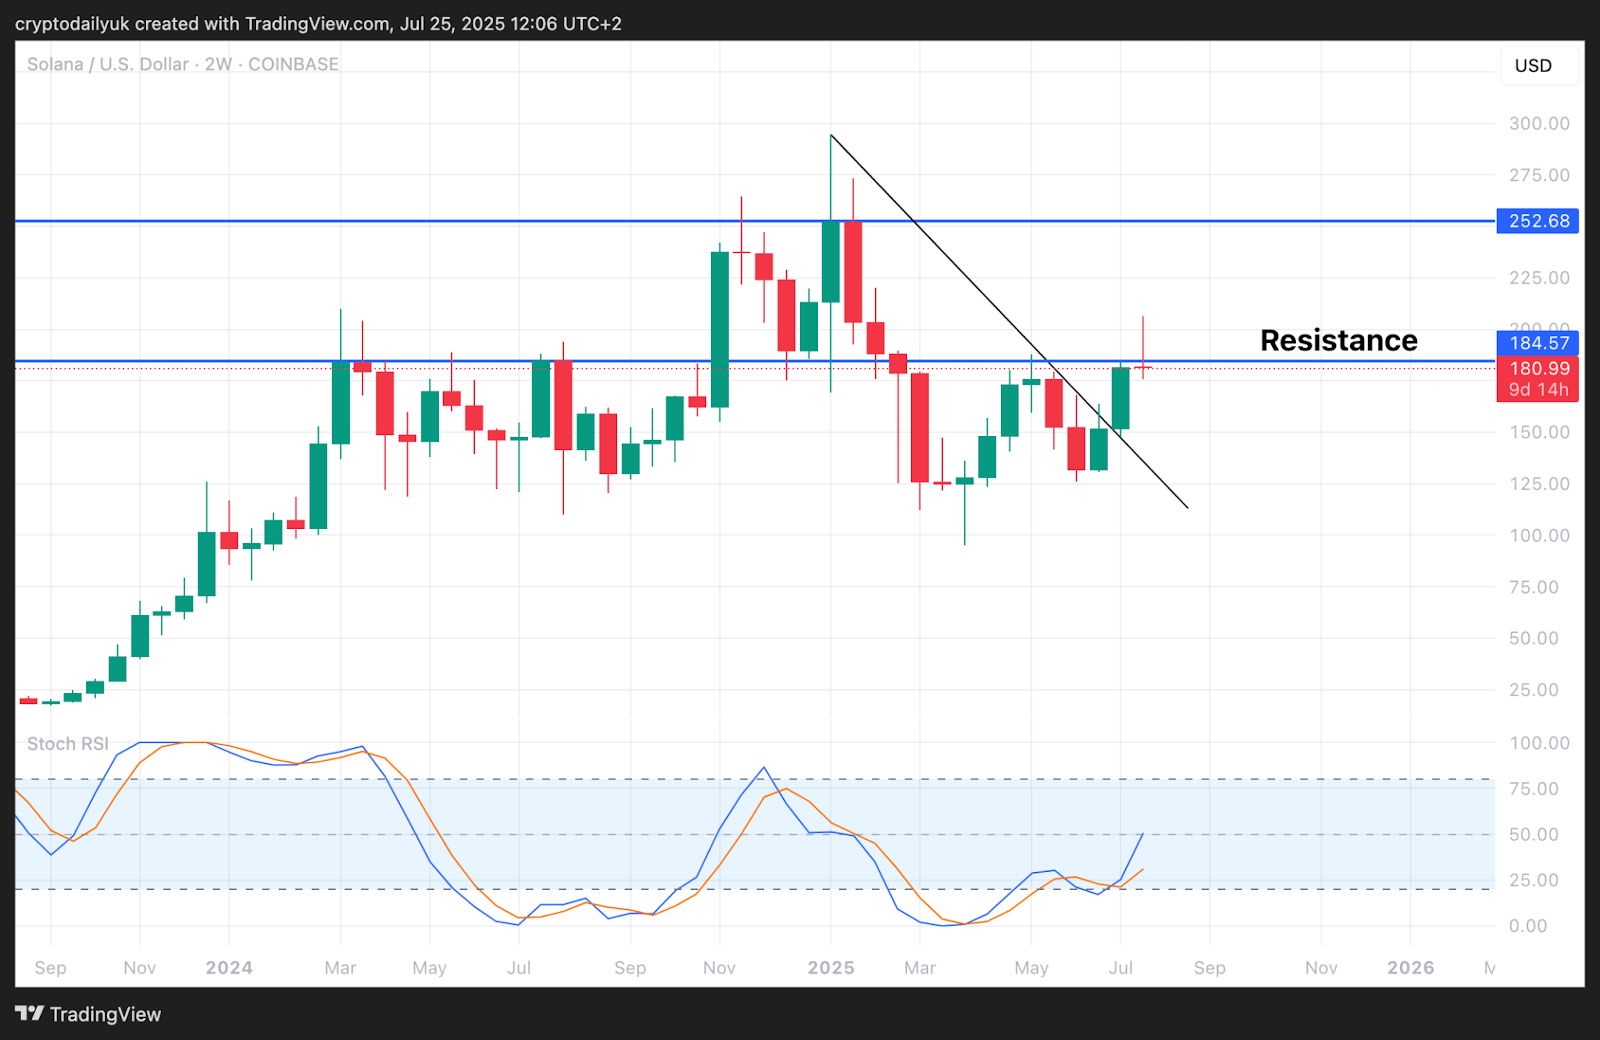
$SOL longer term targets
Source: TradingView
The 2-week chart for the $SOL price shows that the current candle is far from ideal. However, there are quite a few days before this candle closes, and with bullish price action inbound, it might be expected that this candle will close well above the $184 horizontal resistance. If it does so, the next targets are the last decent resistance at $252, followed by the all-time high at $295.
Disclaimer: This article is provided for informational purposes only. It is not offered or intended to be used as legal, tax, investment, financial, or other advice.
source : https://cryptodaily.co.uk