
Ripple (XRP) Surges to New All-Time High: Is the Rally Over?
Ripple (XRP) has just broken its all-time high of $3.40 after a huge sustained surge that took the number 3 cryptocurrency by market capitalisation to $3.66 on Thursday, before settling back slightly. Is the rally now over, or is there more to come?
$XRP sets new all-time high
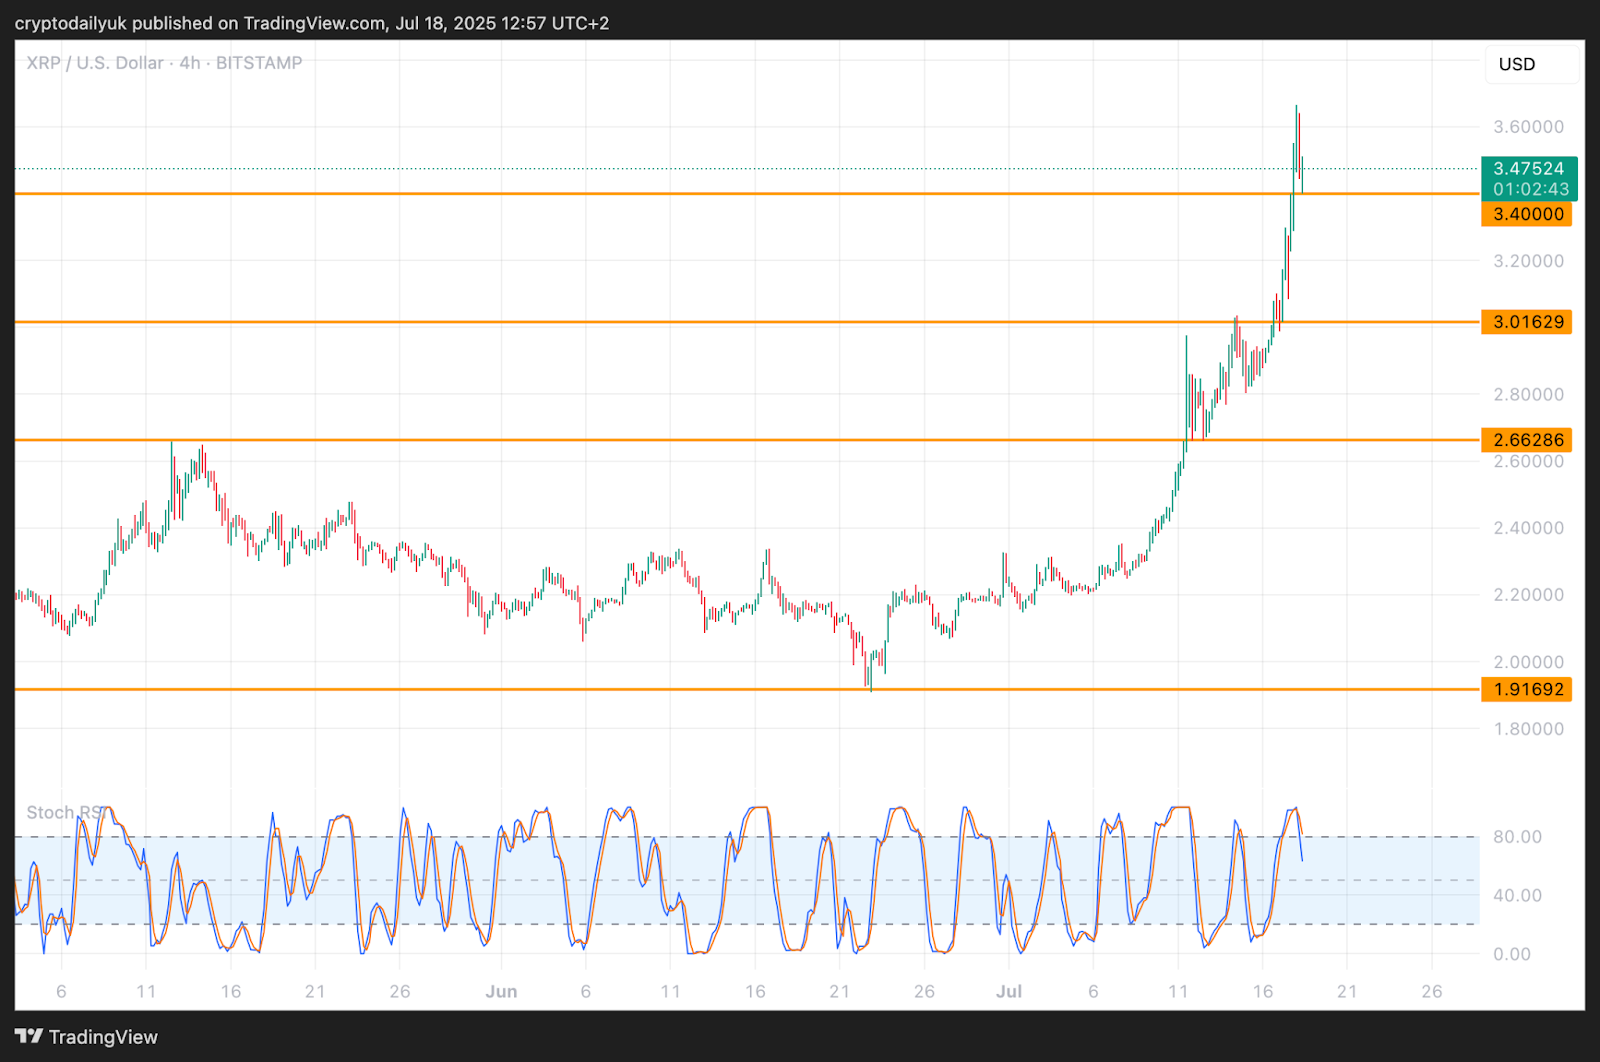
Source: TradingView
Since retesting a local bottom at $1.91, the $XRP price has just surged and surged, taking everyone by surprise, except no doubt, the grand XRP army, who are now probably wearing smiles to match their fortitude in holding a coin that many might have thought was on the way to zero.
This 92% pump has been reward indeed for all those who held on through the misery of that descent to $0.11 following the bull market top of January 2018.
As things stand, some investors could be shorting $XRP right now, content in the knowledge that after such a huge rise in price, and with the all-time high now broken, this heavily-backed altcoin might have had its day.
However, massive caution is advised. Yes, there is likely to be a lot of volatility now that the top has been surpassed, but as can be seen in the short-term price chart above, the $XRP price has been back to exactly tag and retest the previous all-time high before rising again. Look out for some swings this way and that, but if the price stays above $3.40, there could eventually be another break even higher.
$XRP bulls look to build on top of previous high
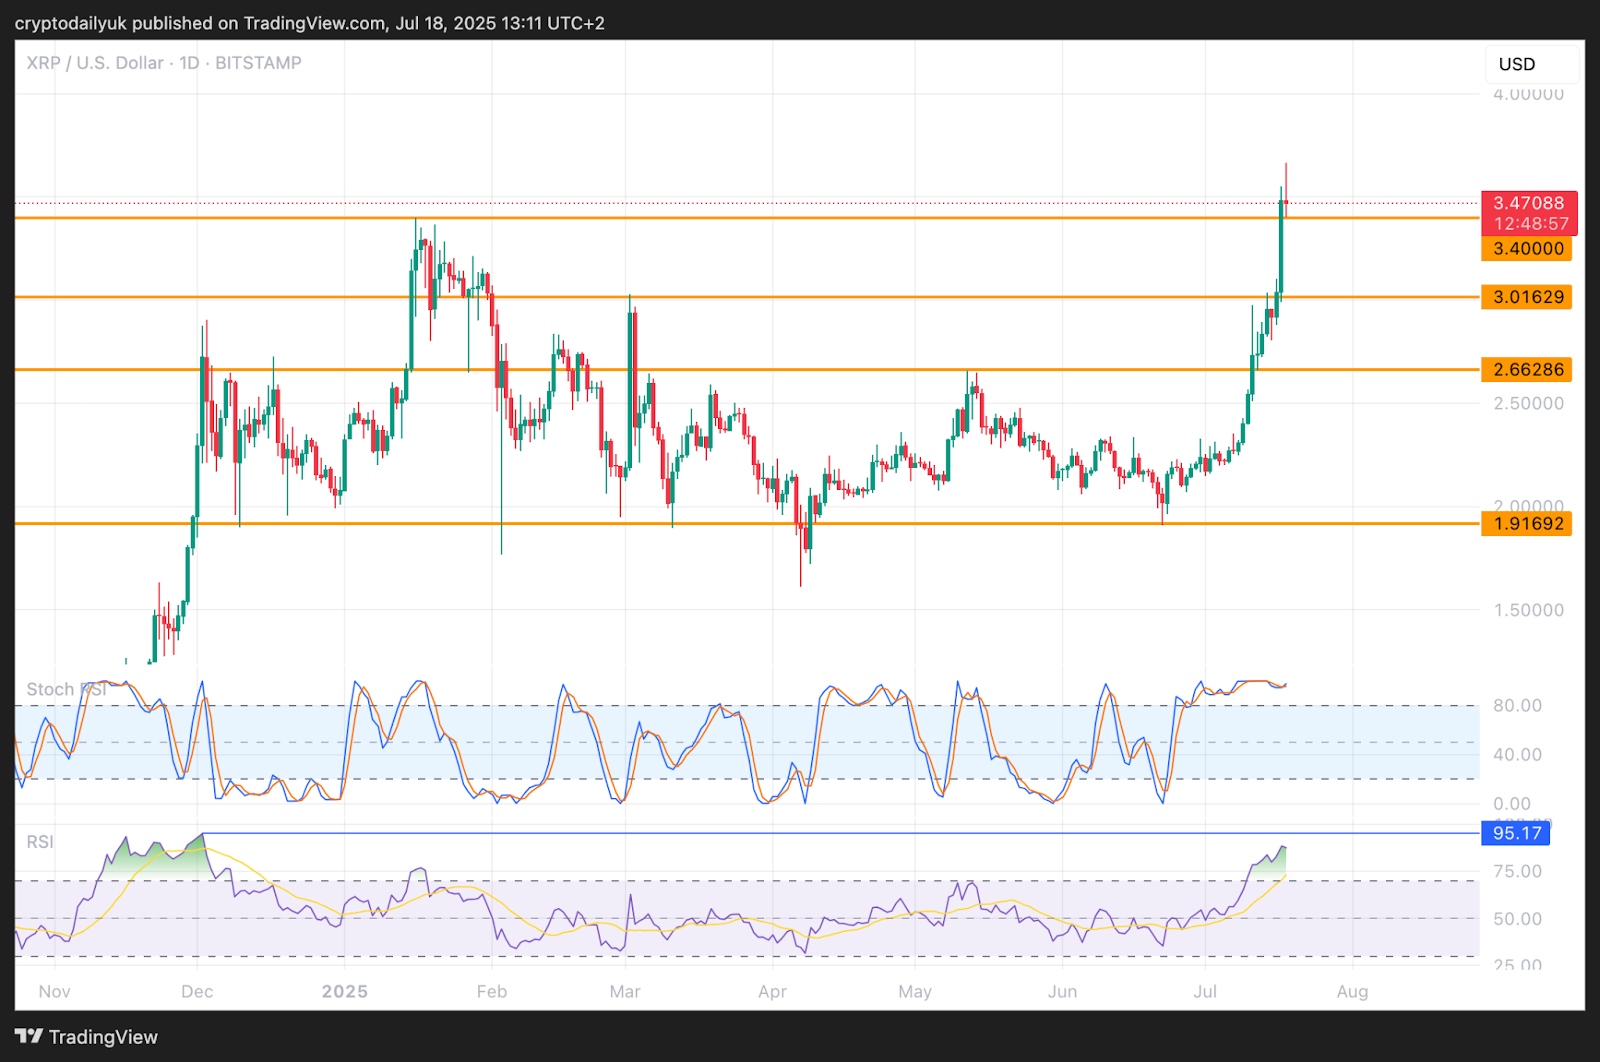
Source: TradingView
The daily chart shows the sideways price action since December 2024. While this might have frustrated some, this was building the price structure for this latest surge. If the bulls can keep the price above $3.40, or perhaps above $3.00, this can provide the platform for further growth.
A slight concern is the height of the Stochastic RSI indicators, which will have to come down and reset at some point. At the same time, the RSI is showing that the indicator still hasn’t surpassed the previous peak at just above 95.00. Given that price action is rising, the indicator will need to avoid a downtrend which could signal bearish divergence.
Do not fade $XRP
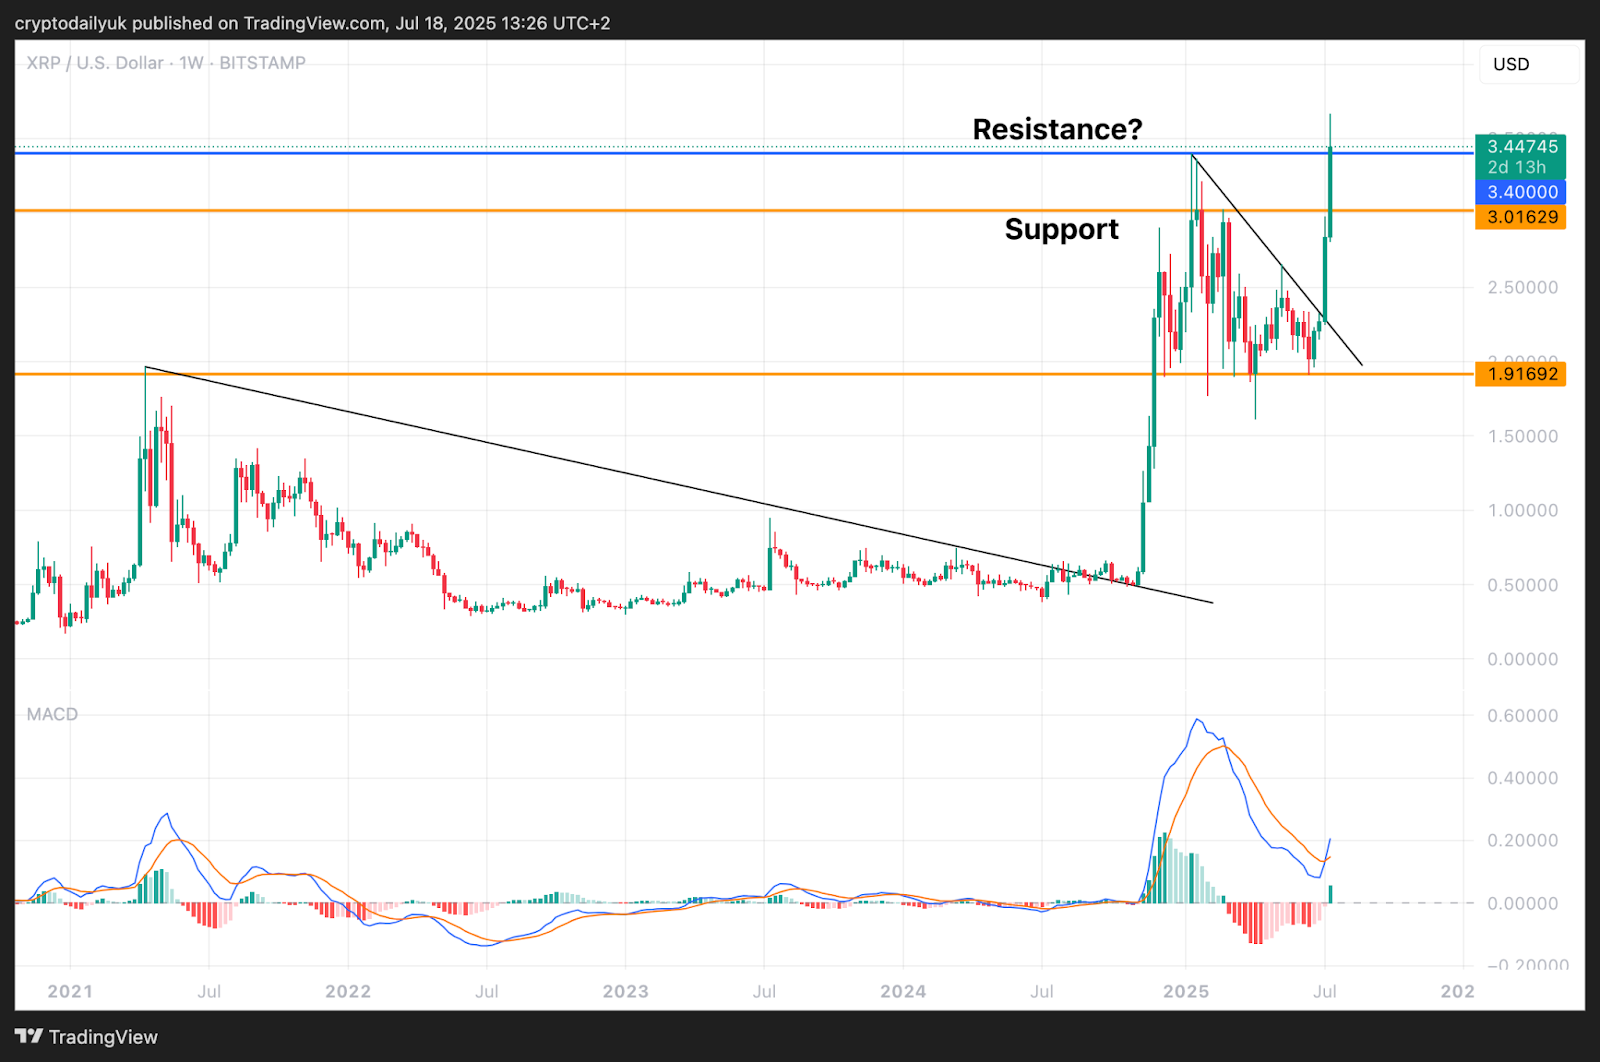
Source: TradingView
The weekly time frame puts the position of $XRP into perspective. While the years through most of 2021 to the end of 2024 were extremely lean, the vertical price pump, once the price had got above the descending trendline, is something to see.
The bulls were then able to lay down quite a bit of price structure on top of the 2021 previous high at $1.96, enabling the eventual surge out of the descending trendline.
Where to next? The bulls will try and flip the blue resistance line into support, which will happen if the price is still above at the end of this week.
The MACD at the bottom of the chart looks very bullish, with a strong cross up of the blue indicator line above the orange signal line. Also, a potential series of green bars may have just begun in the histogram. Do not fade $XRP.
Disclaimer: This article is provided for informational purposes only. It is not offered or intended to be used as legal, tax, investment, financial, or other advice.
source : https://cryptodaily.co.uk