
Bitcoin (BTC) Hits Lower Low Amid Heavy Selling: Price Analysis
A huge whale, an OG from the early days of Bitcoin mining, is still selling a significant amount of 80k $BTC. Amid this heavy selling the $BTC price has fallen as low as $115,000. Could Bitcoin collapse to $112,000, or is a bounce finally about to arrive?
$BTC price forms bull flag
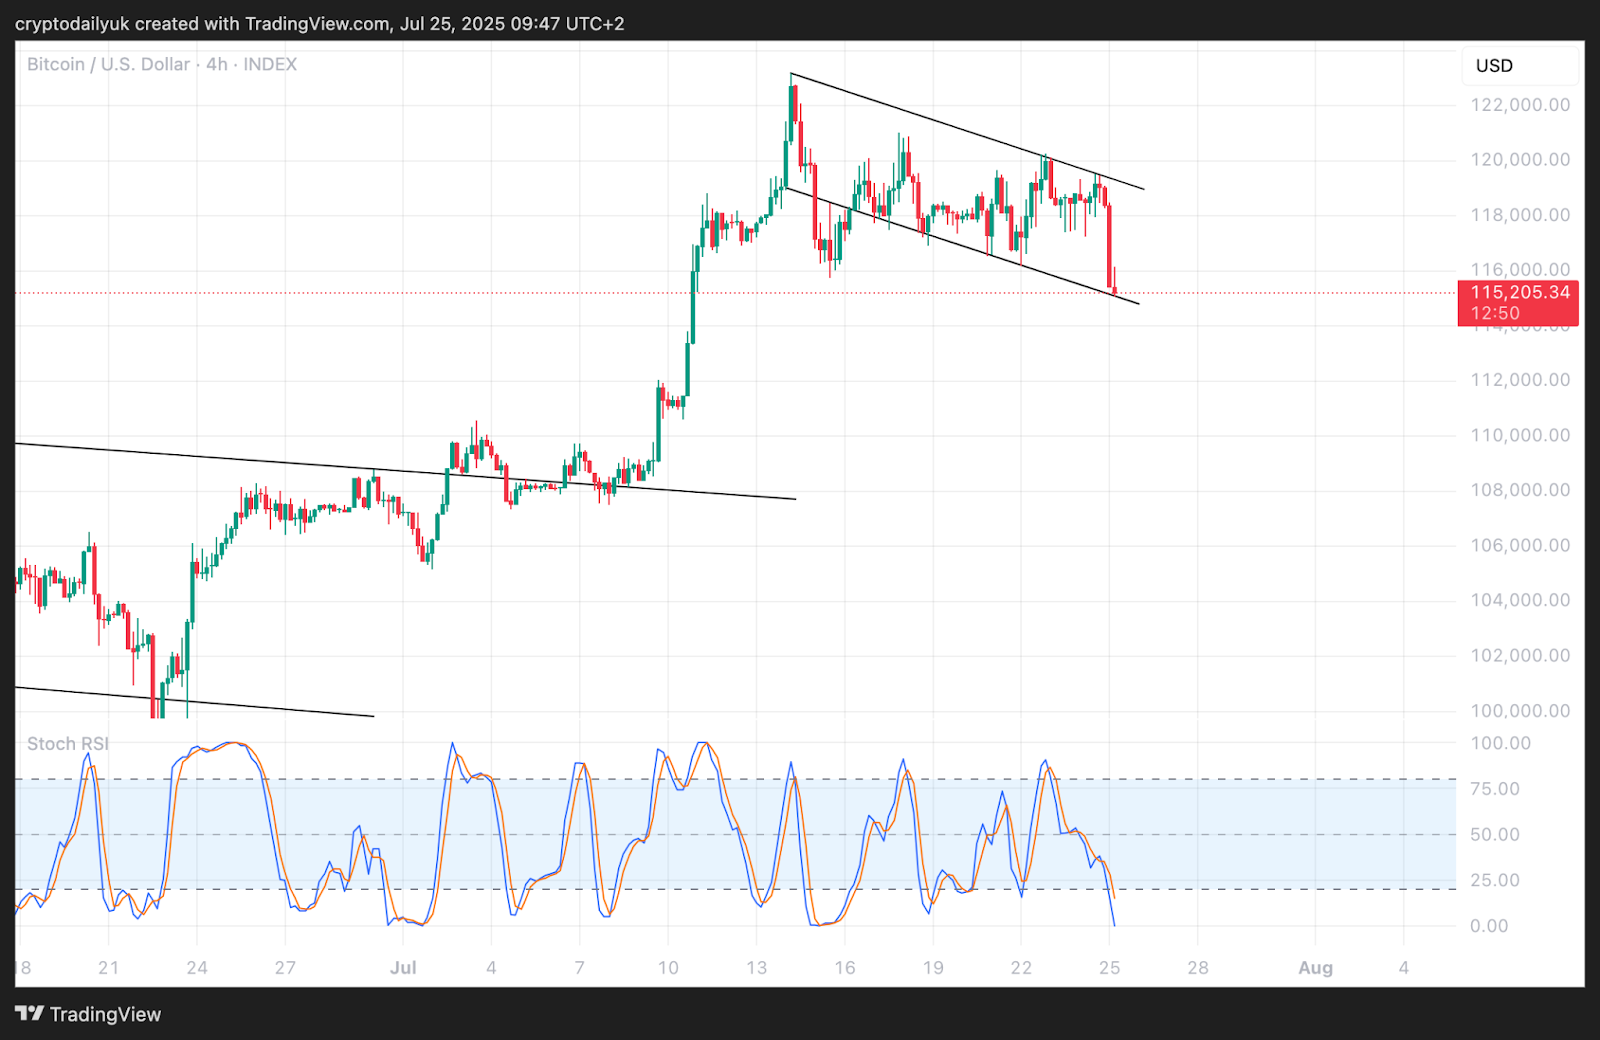
Source: TradingView
The short-term chart for $BTC illustrates how close to the brink the price is right now. The triangle pattern that was previously being drawn for the price action has now been updated to a flag, which after this latest price drop, fits the $BTC movements well over the last several days.
It now remains to be seen whether the bulls can hold the line, or whether the bears can force the price out of the bottom of the flag and confirm below. If the bears do win this struggle, a drop to $112,000 could happen very quickly.
Heavy selling from OG whale
According to the Lookonchain X account, posts tell that 10K $BTC, probably from an OG whale, has recently been sold, and since then, another 2,850 $BTC has been transferred to exchanges. This particular source of selling is ongoing.
So to sum up, one of two scenarios are about to happen. The first scenario is that the price does collapse out of the flag, and a rapid descent to $112,000 ensues. The other scenario is that the bulls are able to defend the bottom of the flag, and that this becomes the point from which a strong bounce can take place. It should be borne in mind that the bull market is continuing, the trend is up, and even if the price does fall back, this could just be a small hiccup on the way.
Measured move out of bull flag to $130,000
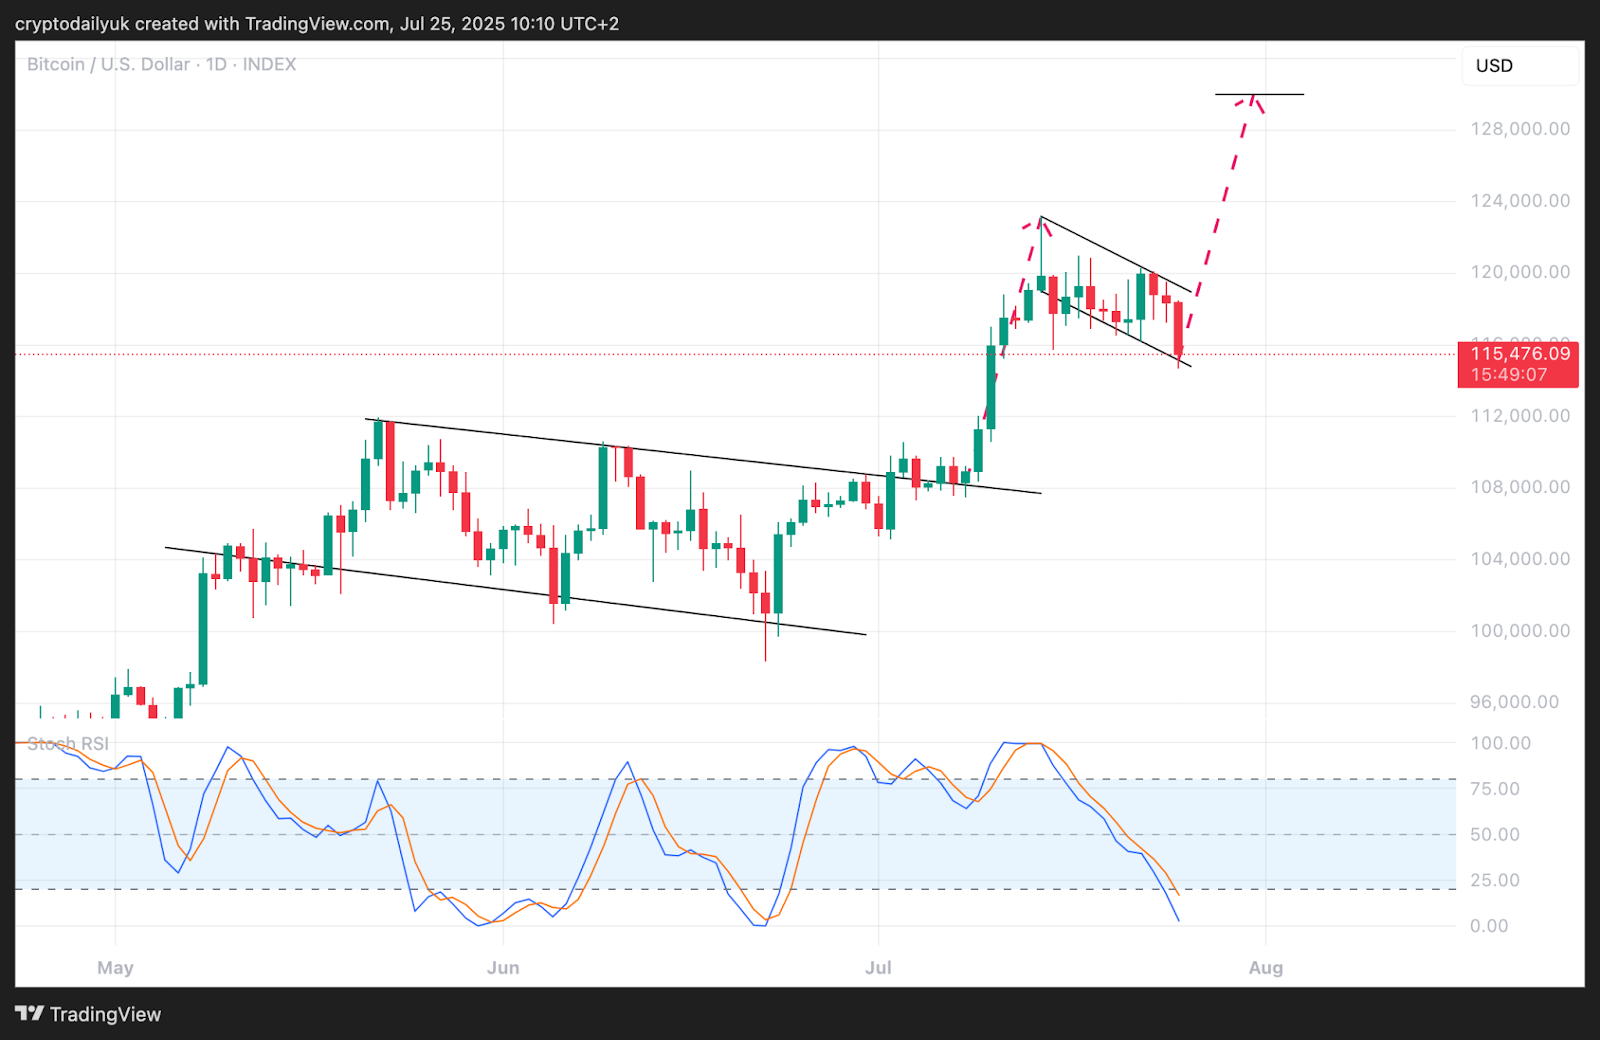
Source: TradingView
The daily time frame shows how the bull flag has now taken shape. If the price does hold where it is now, and then starts to retrace towards the top of the bull flag, a measured move is displayed in the chart above with the dashed red arrows. The height of the pole is taken from the breakout of the previous big bull flag to the top of the current small one. This is then transferred to the bottom point of the flag. The height of the pole corresponds pretty much exactly to $130,000. Could this be the next target?
At the bottom of the chart, the Stochastic RSI indicators are now very close to the bottom. The next day or two could see them angle back to the upside. This current correction is likely drawing to a close.
$BTC price about to become more parabolic?
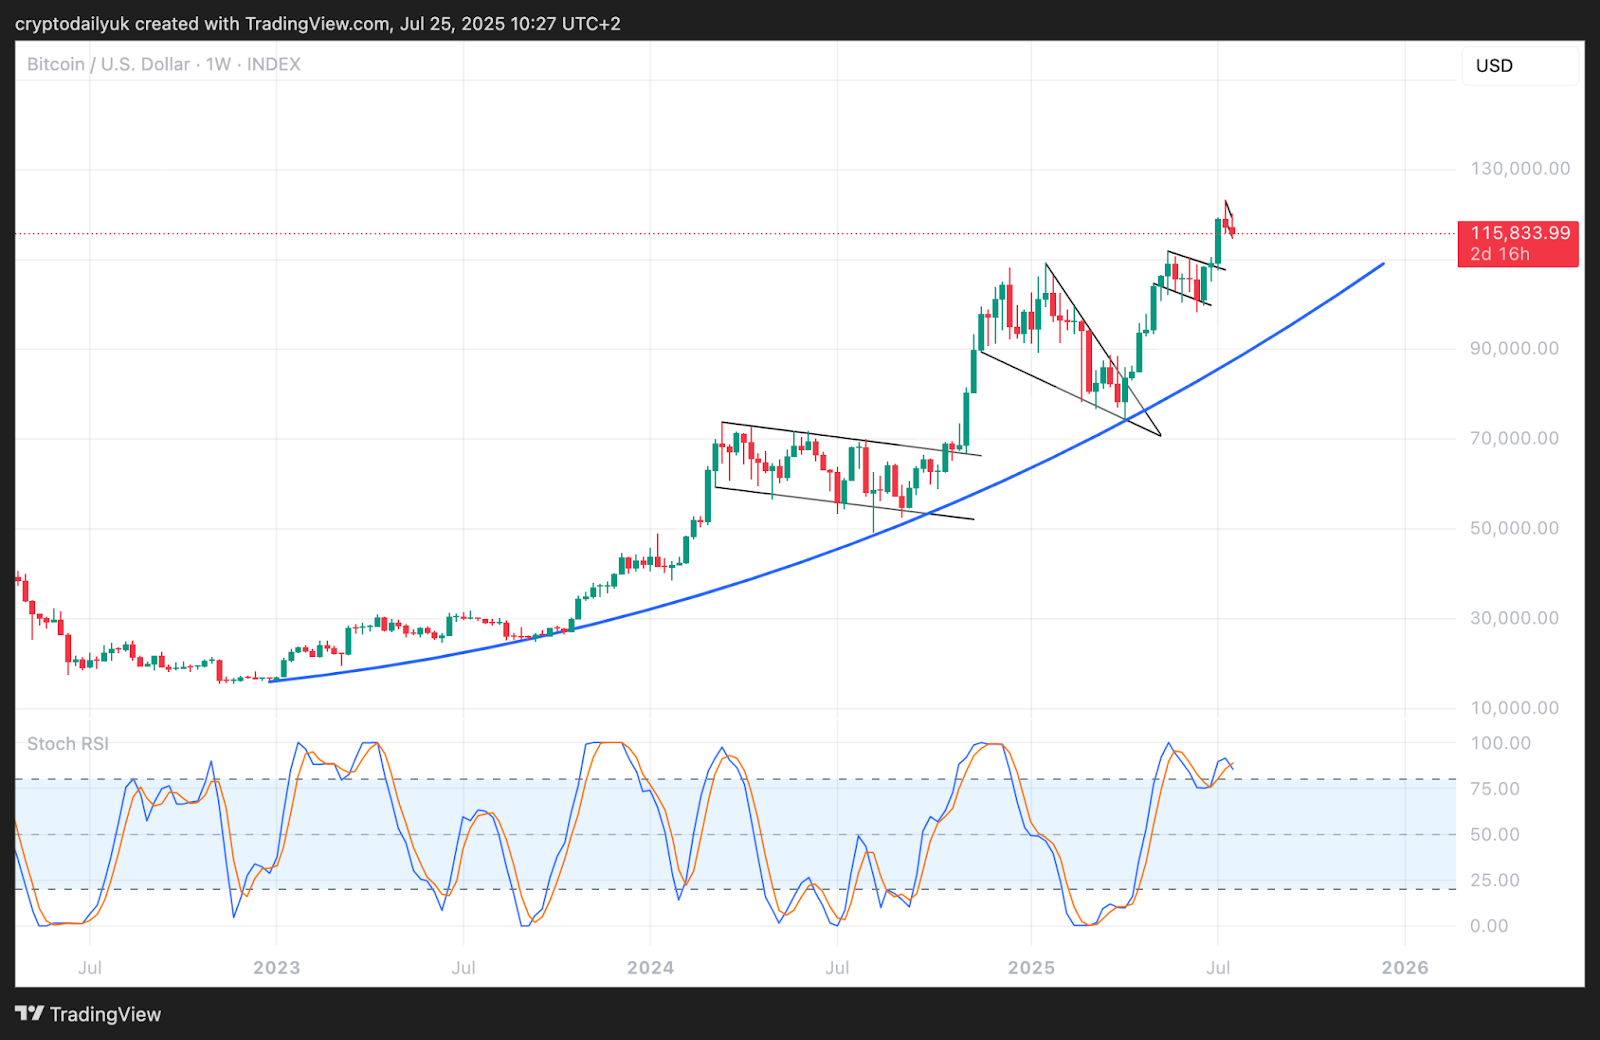
Source: TradingView
The weekly chart, with a curve drawn in, displays how the price is now leaving the curve and is potentially becoming more parabolic. This does make sense if Bitcoin is indeed entering the final phase of its bull run. Having said that, once $130,000 is reached, perhaps another bigger continuation pattern will force the price sideways and down for an extended period, which could see the price make contact with the curve again.
The problem of making these kinds of future guesses is that it is not known whether this particular bull market will be the typical 4-year cycle we have been used to seeing so far, or whether it will be an extended cycle, given the huge influx of institutional money entering the market.
What should be known soon is if the Stochastic RSI indicators on the weekly time frame will cross back up, or whether they will bounce from the 80.00 level and then cross back up. If these indicator lines do stay at the top for an extended period, expect plenty of upside price action.
Disclaimer: This article is provided for informational purposes only. It is not offered or intended to be used as legal, tax, investment, financial, or other advice.
source : https://cryptodaily.co.uk